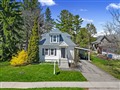
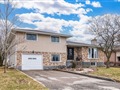
14 Burnham Ave
$504,682
Comparative Market Analysis
May 2, 2024
NOT AN ACTIVE LISTING
Historical Performance
| Period | $ Change | % Change |
| 1 Day | +$34 | +0.007% |
| 7 Days | -$311 | -0.061% |
| 30 Days | -$1,805 | -0.356% |
| 3 Months | -$2,629 | -0.518% |
| 6 Months | -$523k | -50.9% |
| 1 Year | -$47.3k | -8.58% |
| 3 Years | +$59.6k | +13.4% |
| 5 Years | +$107k | +27.0% |
| 10 Years | +$243k | +92.5% |
List My Property
Real Estate Statistics
Financing Solutions
AS SEEN ON


Are You a Licensed Real Estate Agent or Broker?