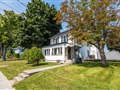
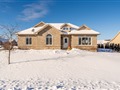
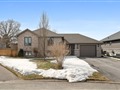
29 Durham St
$402,394
Comparative Market Analysis
Jun 12, 2025
NOT AN ACTIVE LISTING
Historical Performance
| Period | $ Change | % Change |
| 1 Day | +$27 | +0.007% |
| 7 Days | -$202 | -0.050% |
| 30 Days | -$1,213 | -0.300% |
| 3 Months | -$1,356 | -0.336% |
| 6 Months | +$7,584 | +1.92% |
| 1 Year | -$18.3k | -4.36% |
| 3 Years | +$72.7k | +22.0% |
| 5 Years | +$119k | +42.0% |
| 10 Years | +$224k | +126% |
List My Property
Real Estate Statistics
Financing Solutions
AS SEEN ON


Are You a Licensed Real Estate Agent or Broker?